A powerful and automated tool for mapping & modelling the end-to-end supply chain network.
Go to Ginus.ai
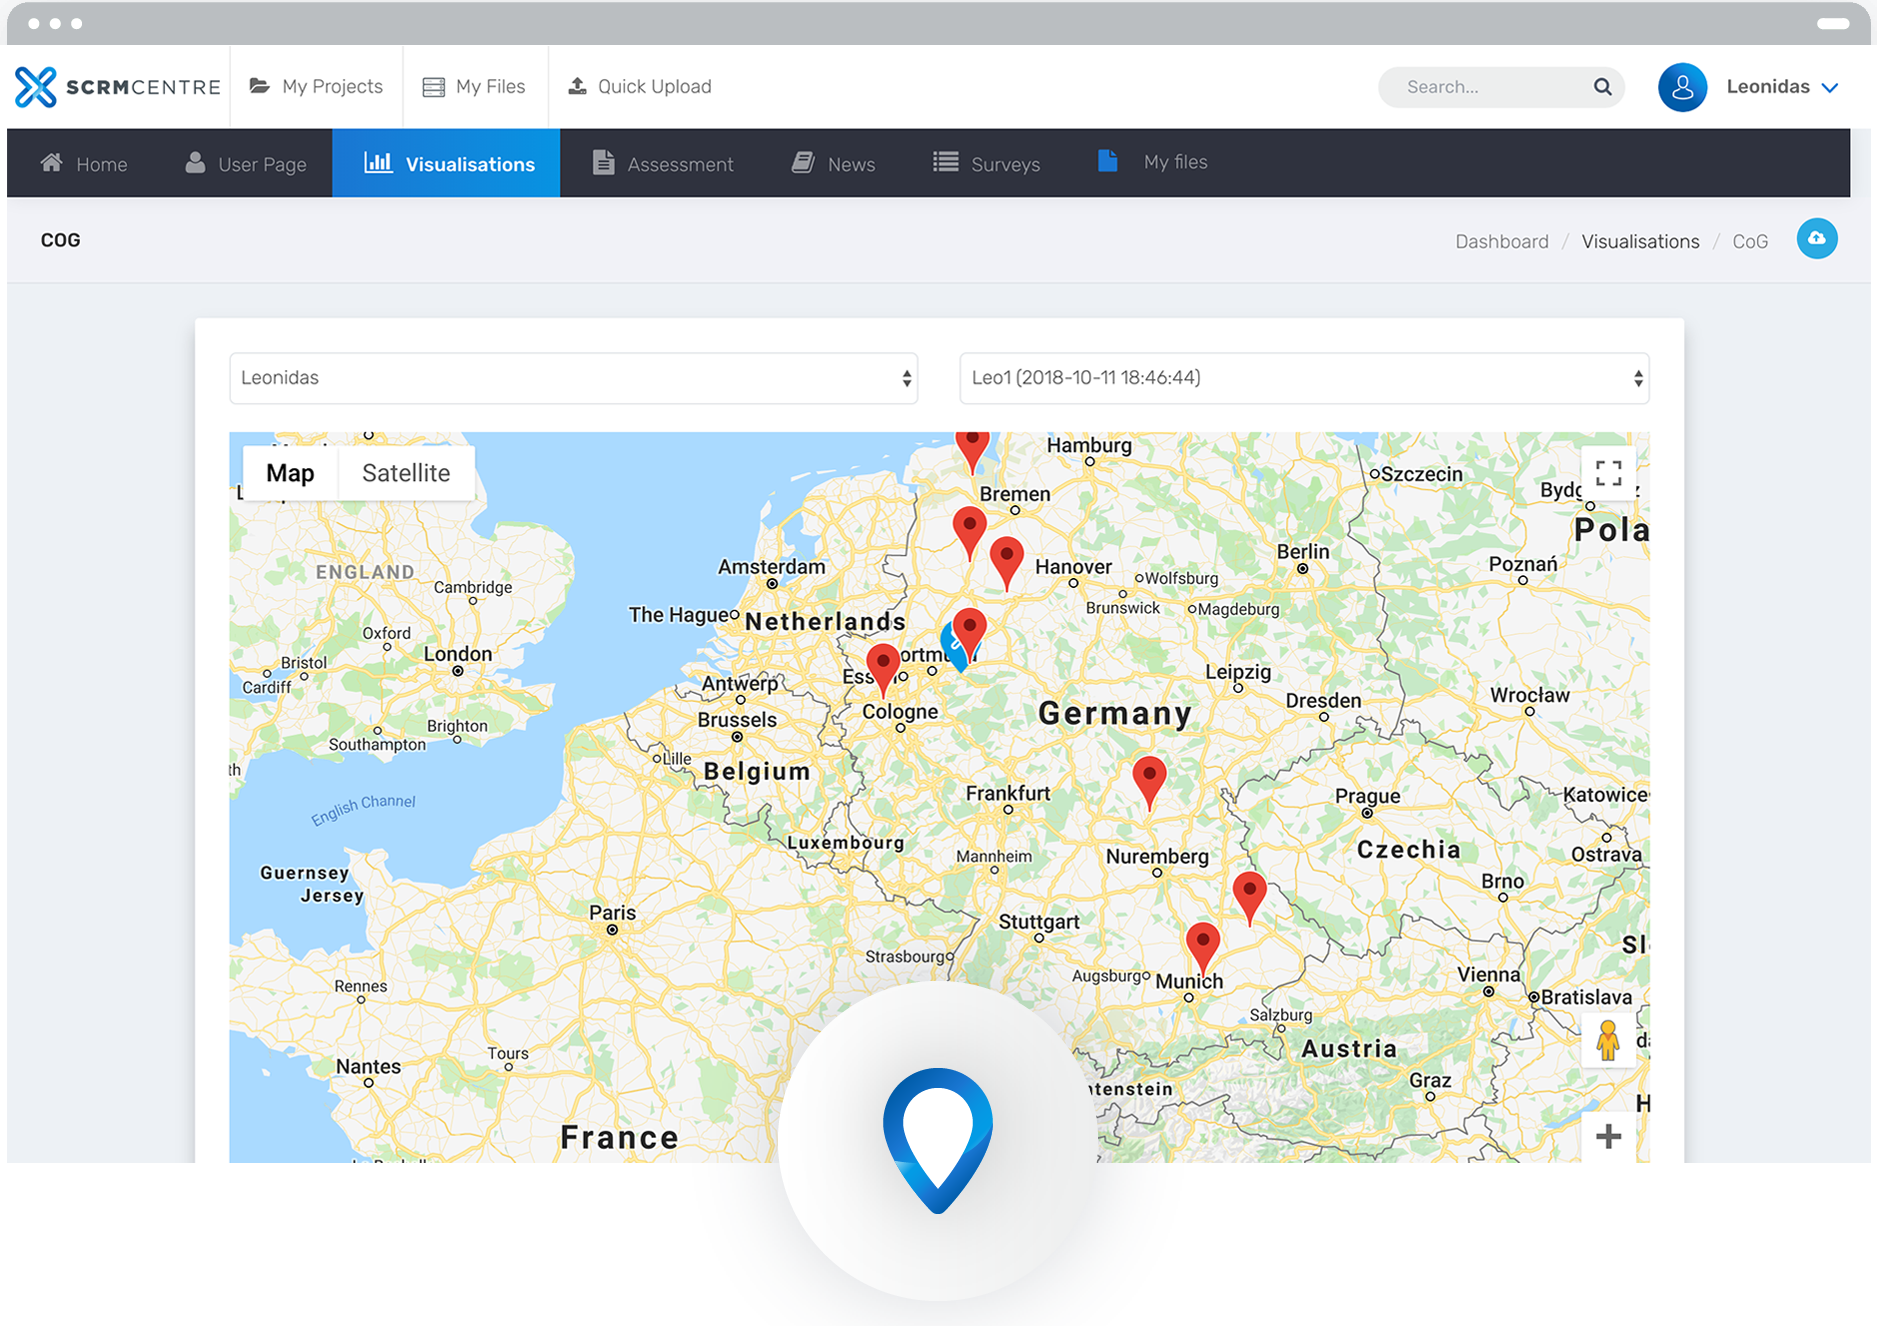
Mapping is a powerful visual aid, when analysing networks, and offers key insights when modelling multiple scenarios or trying to optimise the end-to-end supply chain.
Map customer, supplier or other key locations (nodes) of your network, and use the filters available to create heat-maps and other powerful visuals for your presentations.


Map customer, supplier or other key locations (nodes) of your network, and use the filters available to create heat-maps and other powerful visuals for your presentations.

Make changes to your network, create “if scenarios”, optimise warehouse locations and lanes, based on cost & CO2 emissions, and more.
With following embedded abilities you can replace expensive and complex software applications. Our platform provides you with following automated functions: Center-of-Gravity (CoG), Optimal Warehouse Selection, Optimal Supplier/Factory Selection, Cost-to-Deliver (C2D) and Cost-to-Supply (C2S), Route-Optimisation… and more.
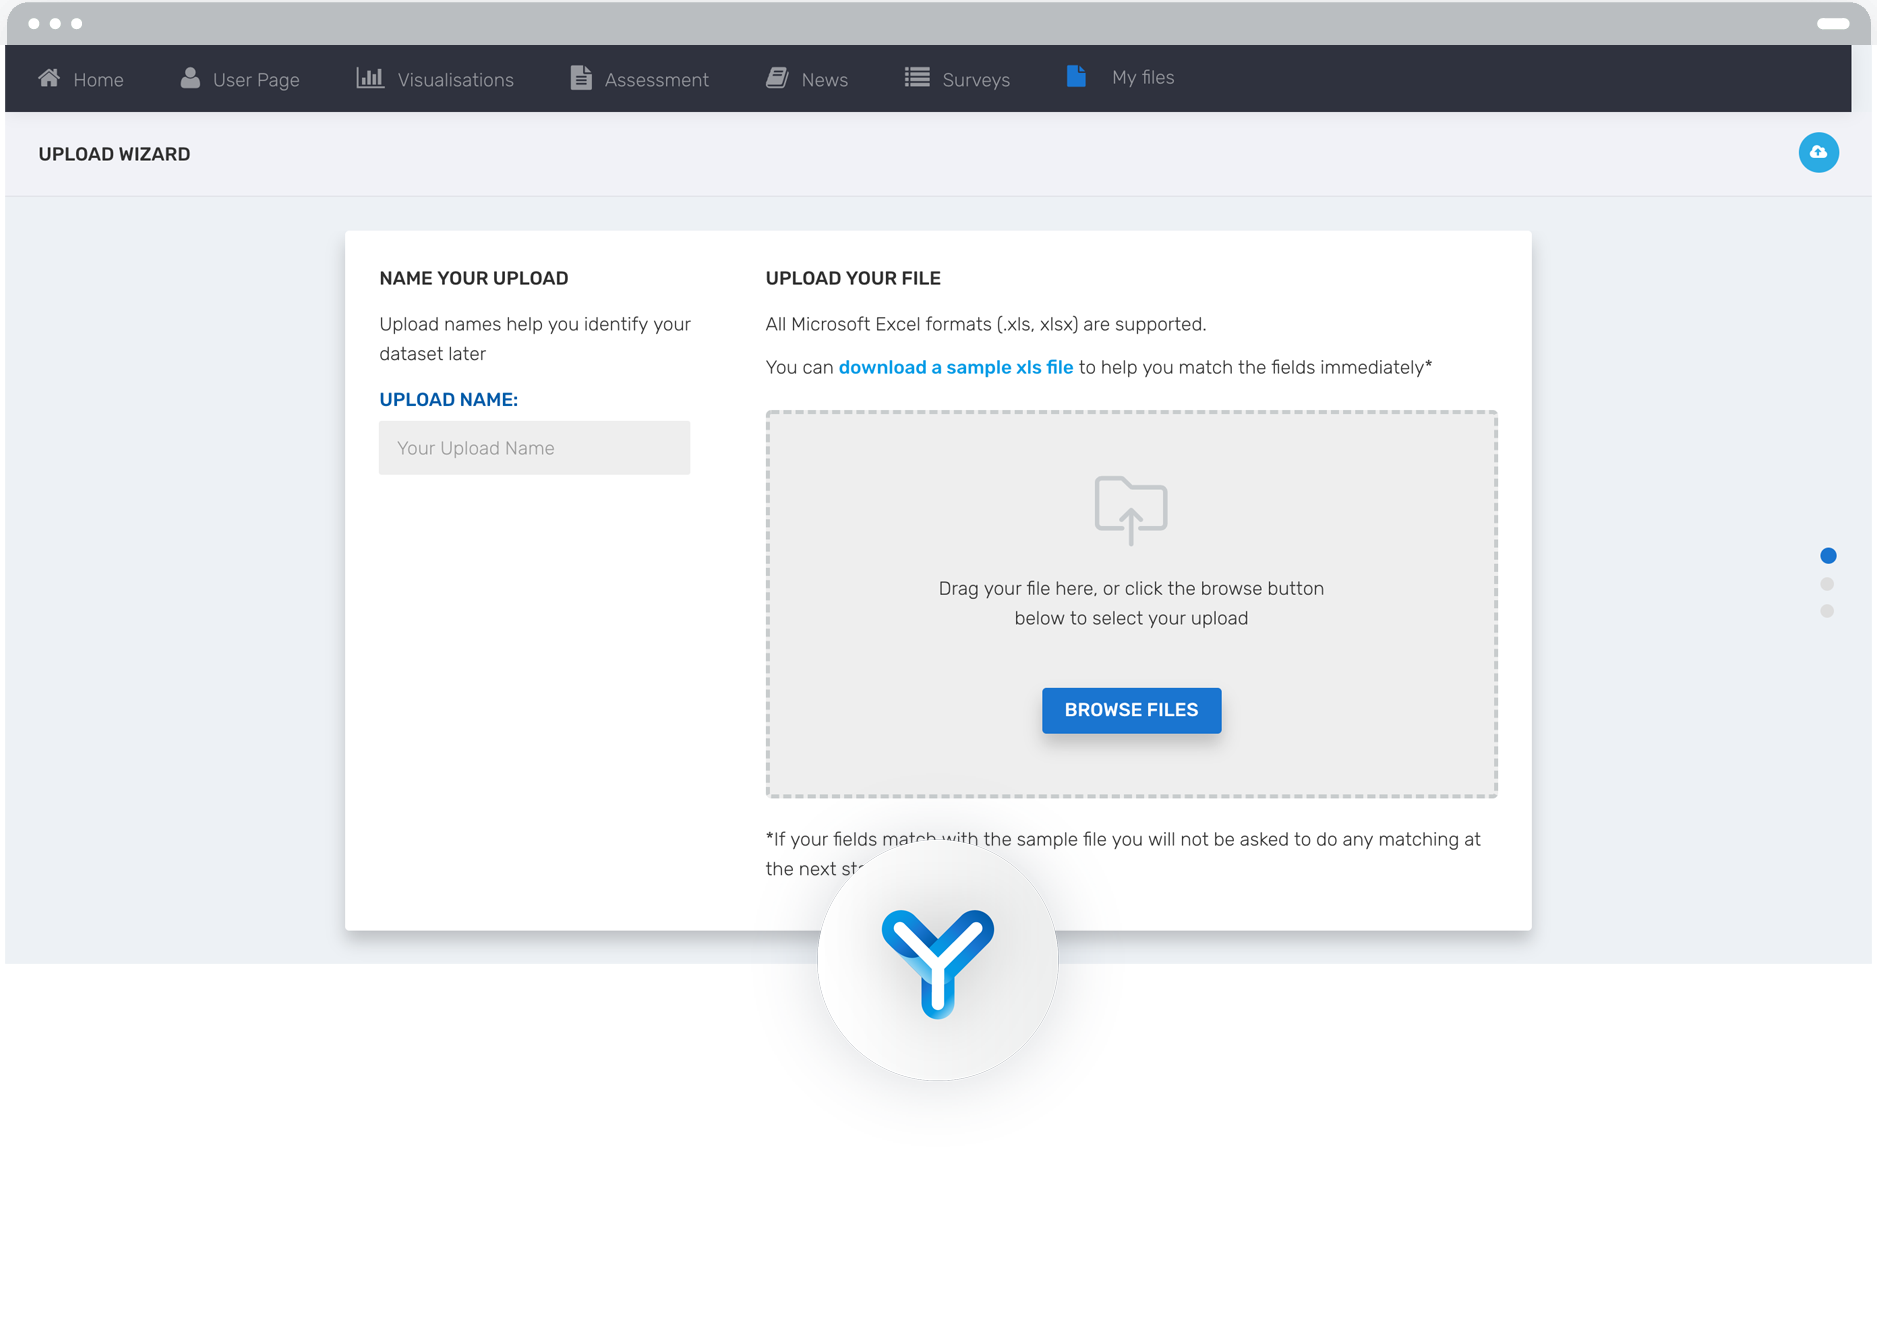
Integrate your company’s operational and spatial (geo-located) data, with other data sources, and include them in your visuals to compare and draw conclusions easier, on the areas of your network you need to focus on.